Assignment 5: Simple Summaries and Viz
Analyze a basic summary and make a visualization in Datawrapper
For this exercise, please download the dataset here and work with it in Orange to create a summary, finally visualizing your numbers in Datawrapper.
This dataset contains information on the demographic representation of artists through editions of Janson’s History of Art and Gardner’s Art Through the Ages, two of the most popular art history textbooks used in the American education system. We have some very interesting variables, the data dictionary for which is available here. Take a look through the variables that are available to you.
Once you’re familiar with the dataset, proceed in the following manner:
- In Orange, open up this dataset and view some
Feature Statisticsto understand what is going on, what are your numeric and categorical variables. - Form a question. In class, we took some examples such as “Who [men/women] is represented more in the Whitney exhibitions”.
- Consider what variables will help you answer this question. In this case, we’d want to count a
totalof how many times men or women exhibited (which is in thewhitney_count_to_year) variable. - Using
FilterorGroup Byin Orange, reduce this entire dataset to a summary. - Visualize this summary in Datawrapper. Think of what chart type would help you achieve your function. DO NOT just use a random chart type, think about the purpose of the chart and what it needs to show (magnitude, correlation, change-over-time etc.).
- Ensure your chart is properly labelled, has legends if it needs them, has a good title and subtitle.
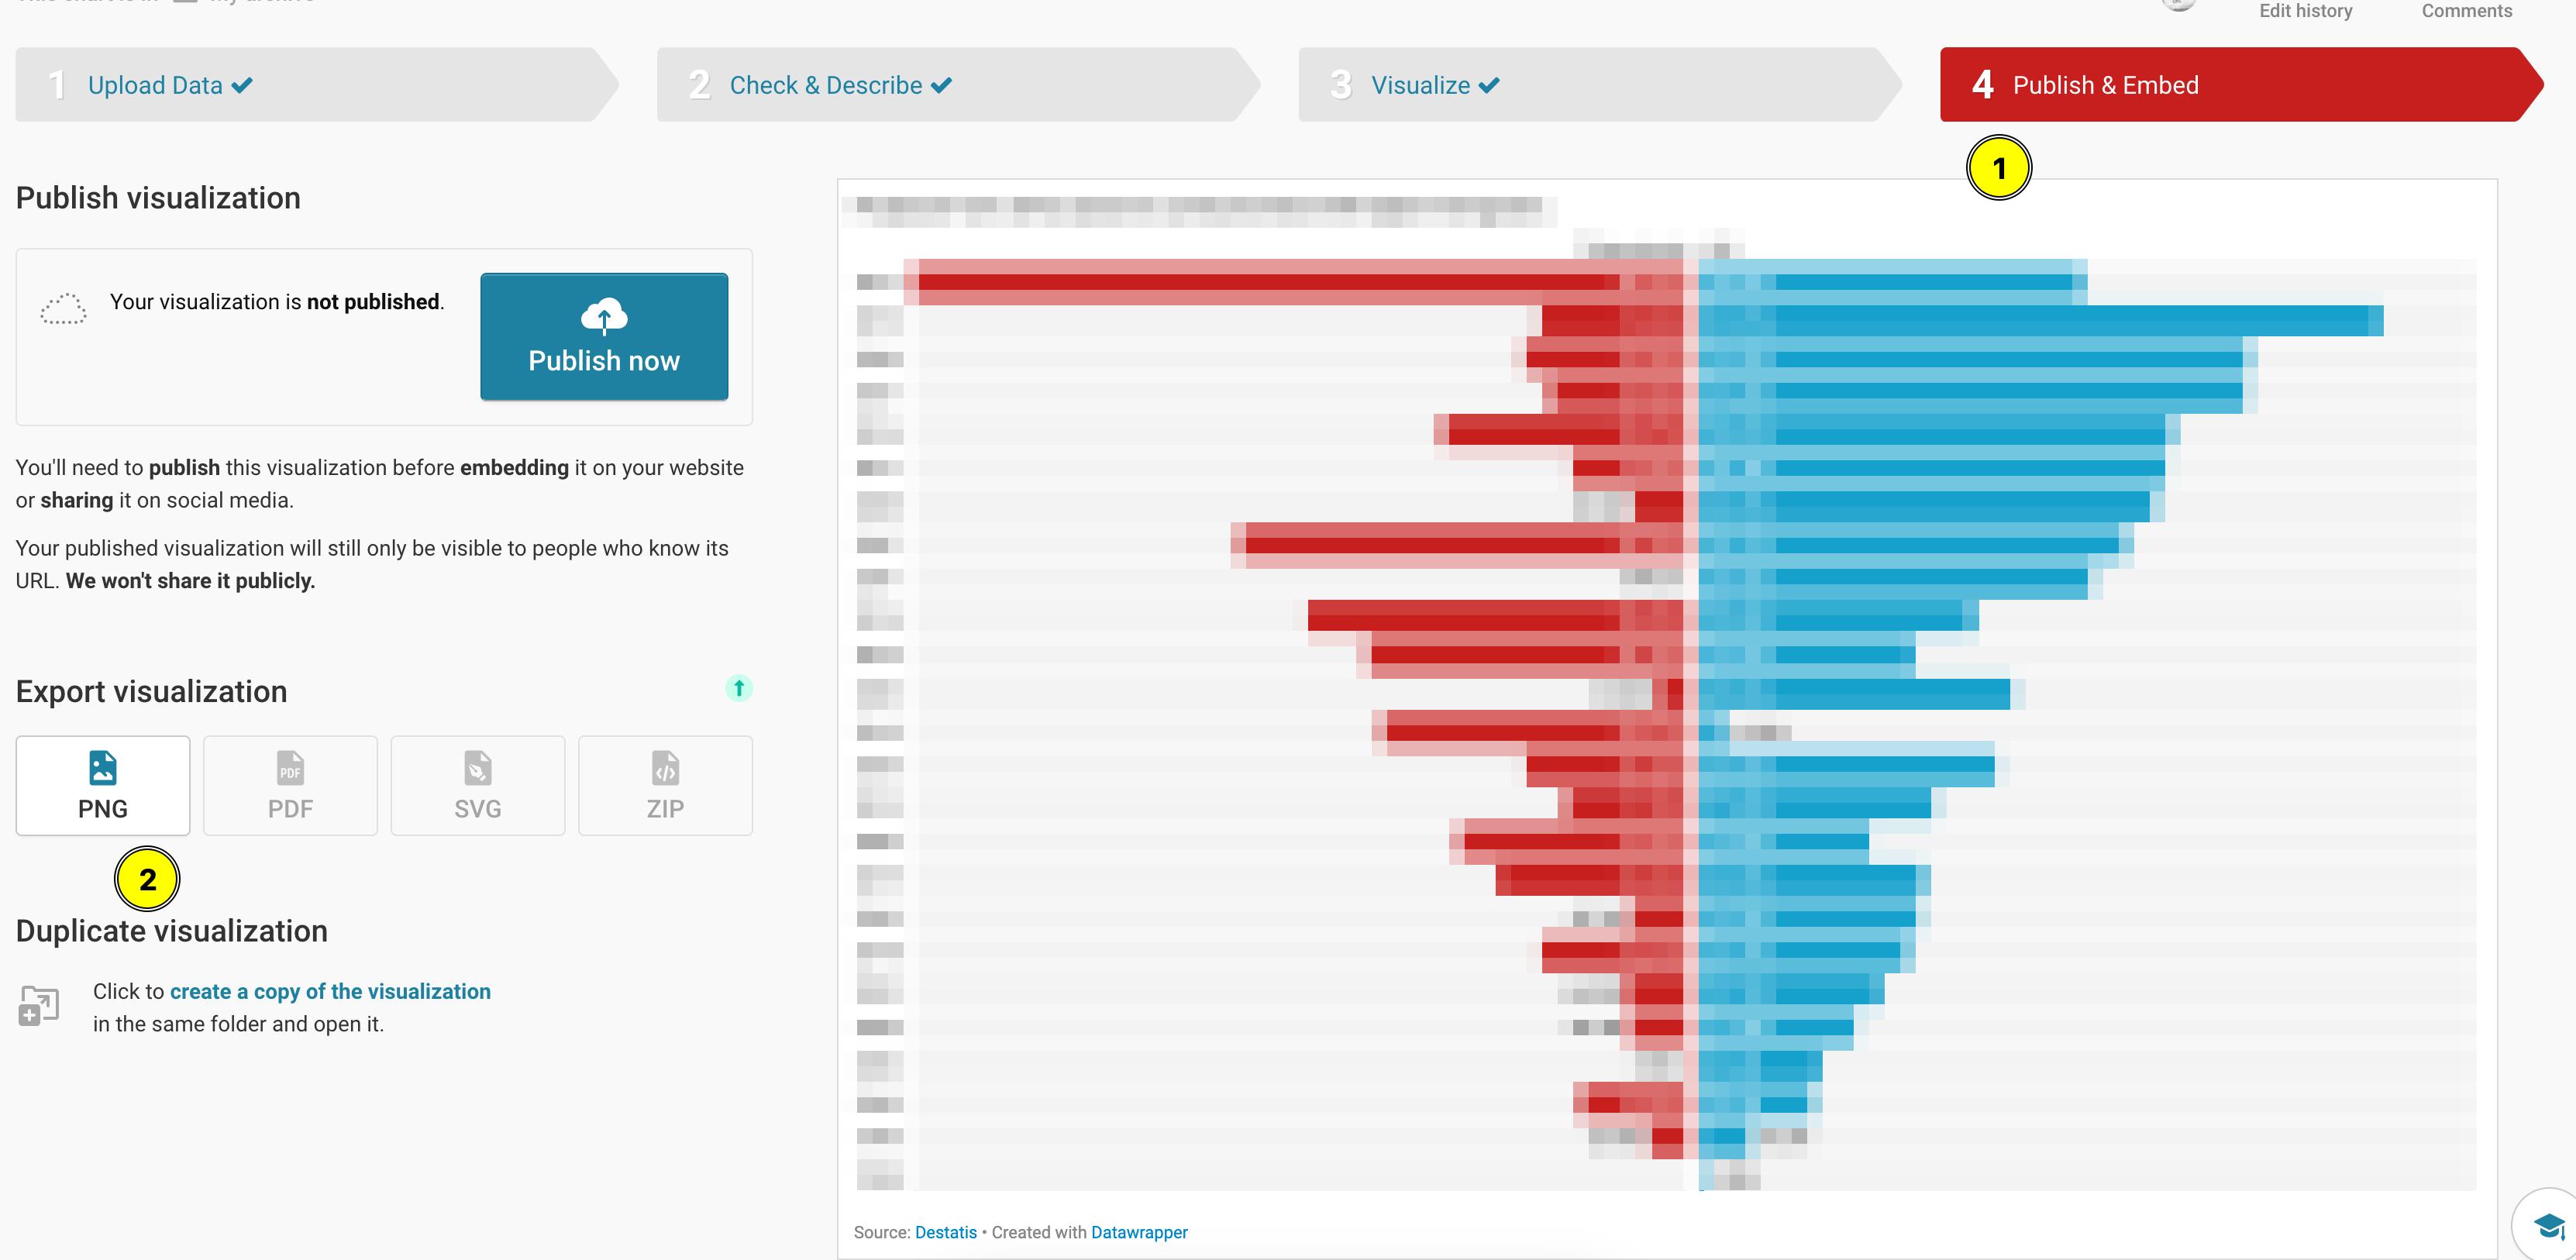
- Once done, click on ‘Publish and Embed’ in Datawrapper and select ‘Download as PNG’ (image attached below).
I have presented the above summary steps as an EXAMPLE, it is not what “I want you to do”. Please conduct your own inquiry and form your own question.
Submission Guidelines
In a PDF, attach the following:
- Your name, roll number.
- Your question.
- Steps you took to arrive at the summary (“I grouped by gender and calculated mean of X”).
- Screenshot of your Orange’s
Group Bywindow. - Image of your chart.
- If you have any other thoughts or explorations, add those too.
PLEASE ENSURE YOU NAME YOUR PDF PROPERLY. It should be of the format YOUR_NAME_ASSIGNMENT_5.pdf.