Common queries you might have about our final project datasets.
📦 Spotify Songs
How do I convert duration_ms to minutes?
The Spotify dataset measures duration of a song in milliseconds. If you want to convert this to minutes, the formula is:
duration_ms / 60000Dividing duration by 60,000 will give you the same value in minutes. Create a new formula with a NUMBER type (refer to the guides below for using the formula widget) and enter the above expression to create a new column to add this minute information to your dataset.
How do I extract year from the album release date?
Suppose you want to track the evolution of a variable over time. The current dataset provides only album release dates, but maybe we care about the year only.
Open your dataset in Orange and add the FORMULA widget.
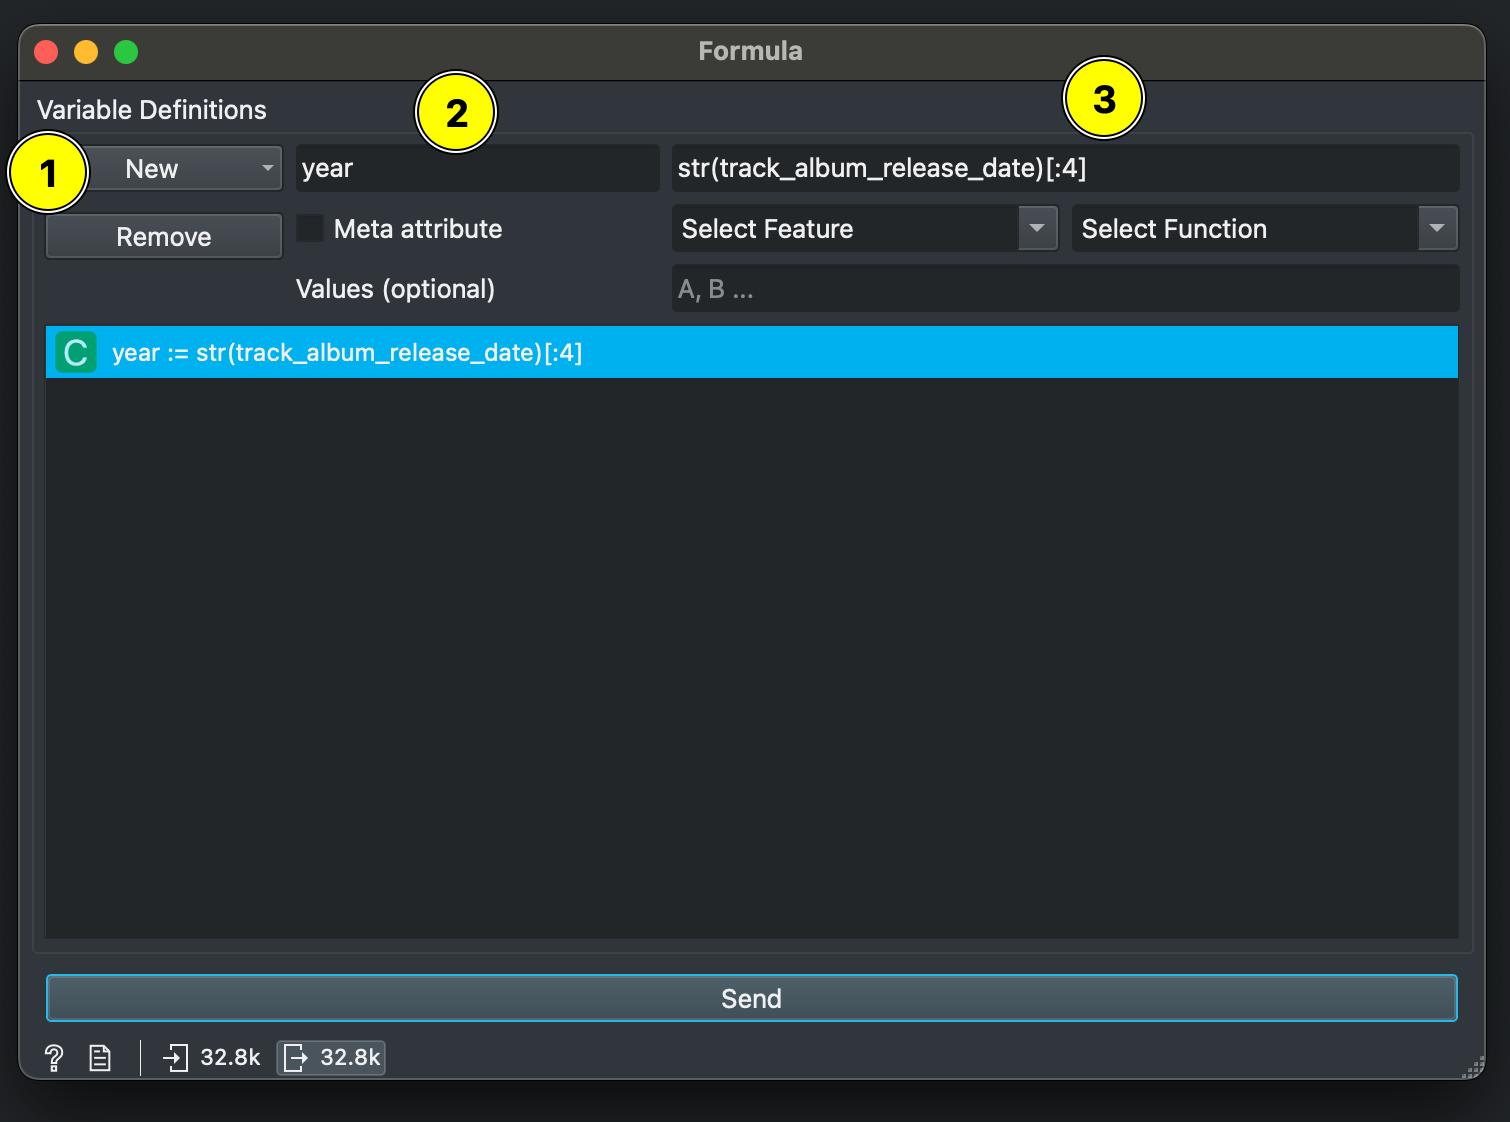
Click ‘New’ and choose Categorical as the variable type. In the first field marked 1, add the new column name we’re creating which is year. In the field marked 2, enter this expression:
str(track_album_release_date)[:4]
What this does is convert the track_album_release_date to a string (categorical) variable and then extract only the first 4 letters from that string, which in our case is the year!
Click ‘Send’ (marked 3) to create this new column.
Now when you connect a DATA TABLE from this FORMULA column, you should see a new column called year being created.
📦 Titanic
How can I categorize age based on ranges?
The Titanic dataset contains different ages, but suppose you want to categorize them as child, adult, baby etc.
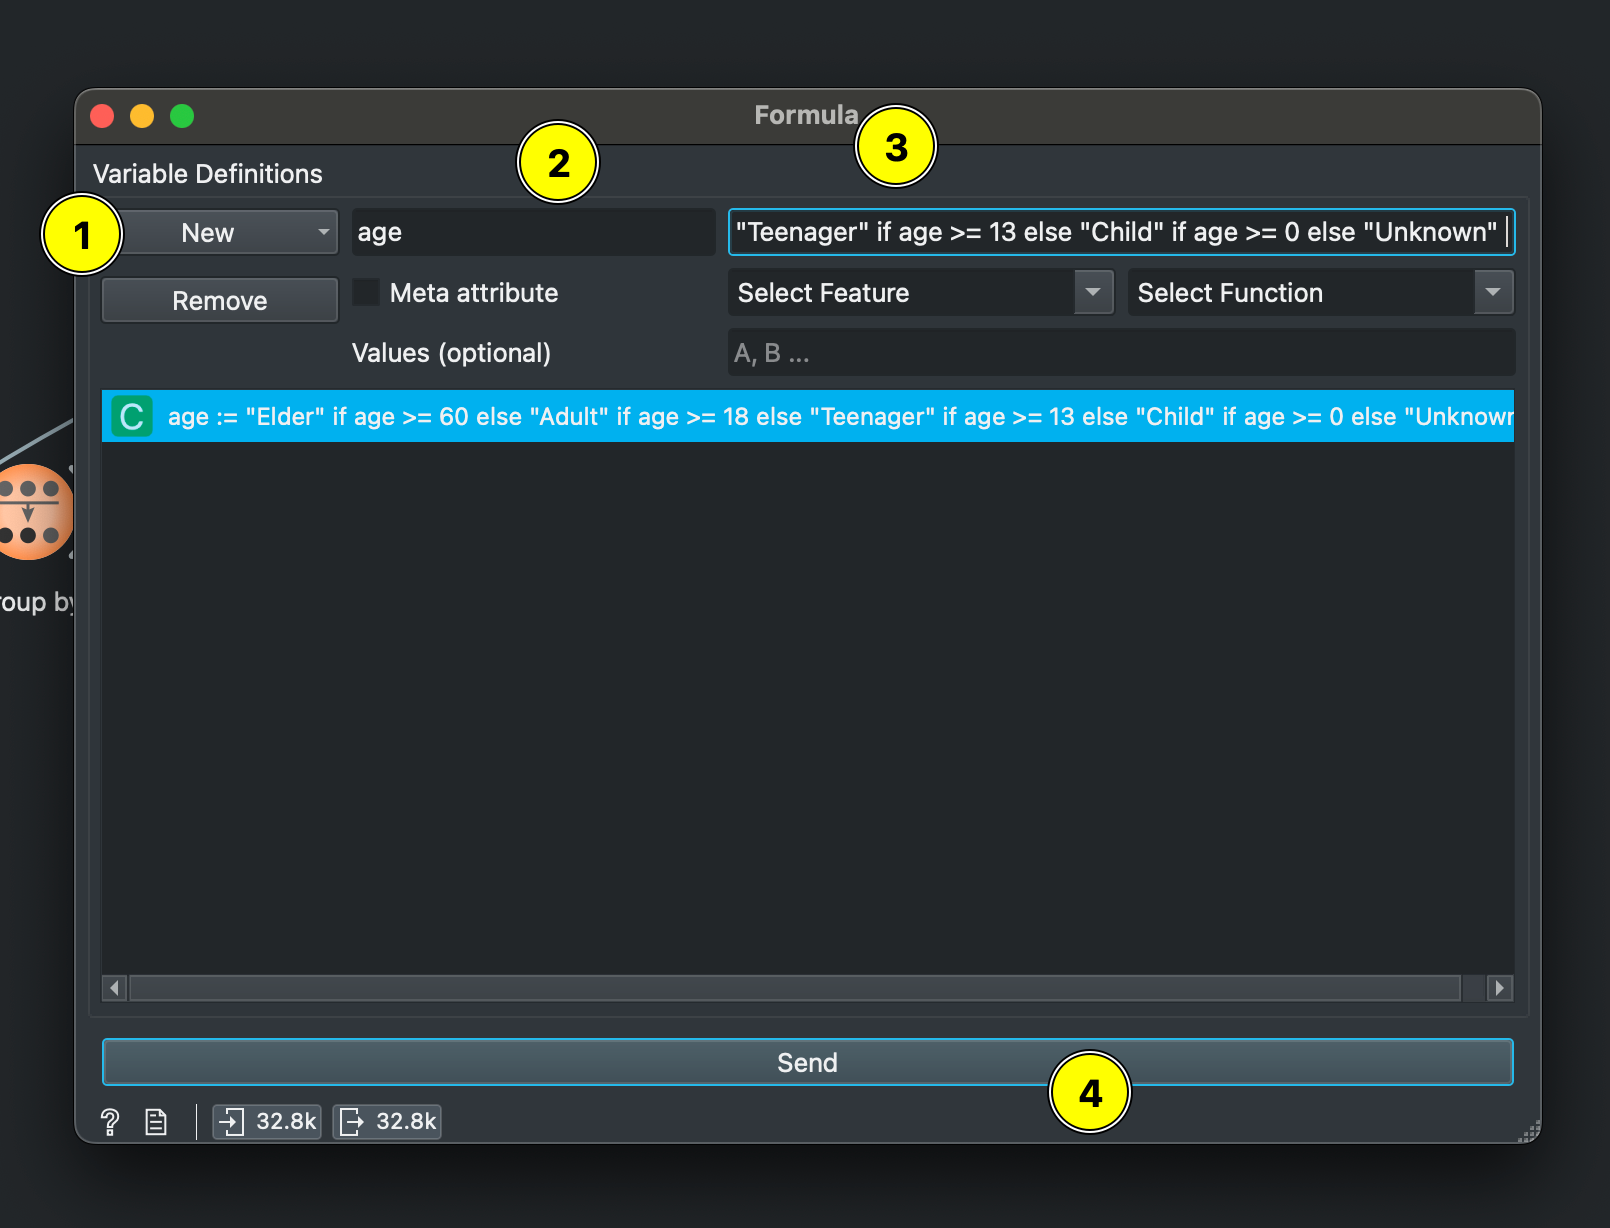
Connect your data to the FORMULA widget. Click ‘New’ and choose Categorical as the variable type. In the first field marked 1, add the new column name we’re creating which is age_category.
In field 3, enter your condition:
"Elder" if age >= 60 else "Adult" if age >= 18 else "Teenager" if age >= 13 else "Child" if age >= 0 else "Unknown"What we’re doing is defining conditions using “IF THIS, THEN THAT” logic by using the age variable. This is useful for other things too. In simple language, the above code says: “If someone’s age is 60 or above, categorize them as ‘Elder’. Otherwise, if they’re 18 or above, categorize them as ‘Adult’. Otherwise, if they’re 13 or above, categorize them as ‘Teenager’. Otherwise, if they’re 0 or above, categorize them as ‘Child’. If none of these conditions are met (like if age is missing or negative), categorize them as ‘Unknown’.”
Remember to click Send to actually process this. You’ll have created a new column with these categories.
📦 Global Human Day
How do we calculate working hours and non-working hours?
In this dataset, “work” isn’t presented as a single category. Instead, the researchers have categorized activities based on their motivating outcomes rather than whether they’re paid or unpaid. One way to figure our how many hours are being spent in both of these (work vs. life) is to sum the economic activity hours and the non-economic activity hours separately and compare.
For instance, have a look at the Orange set-up below:
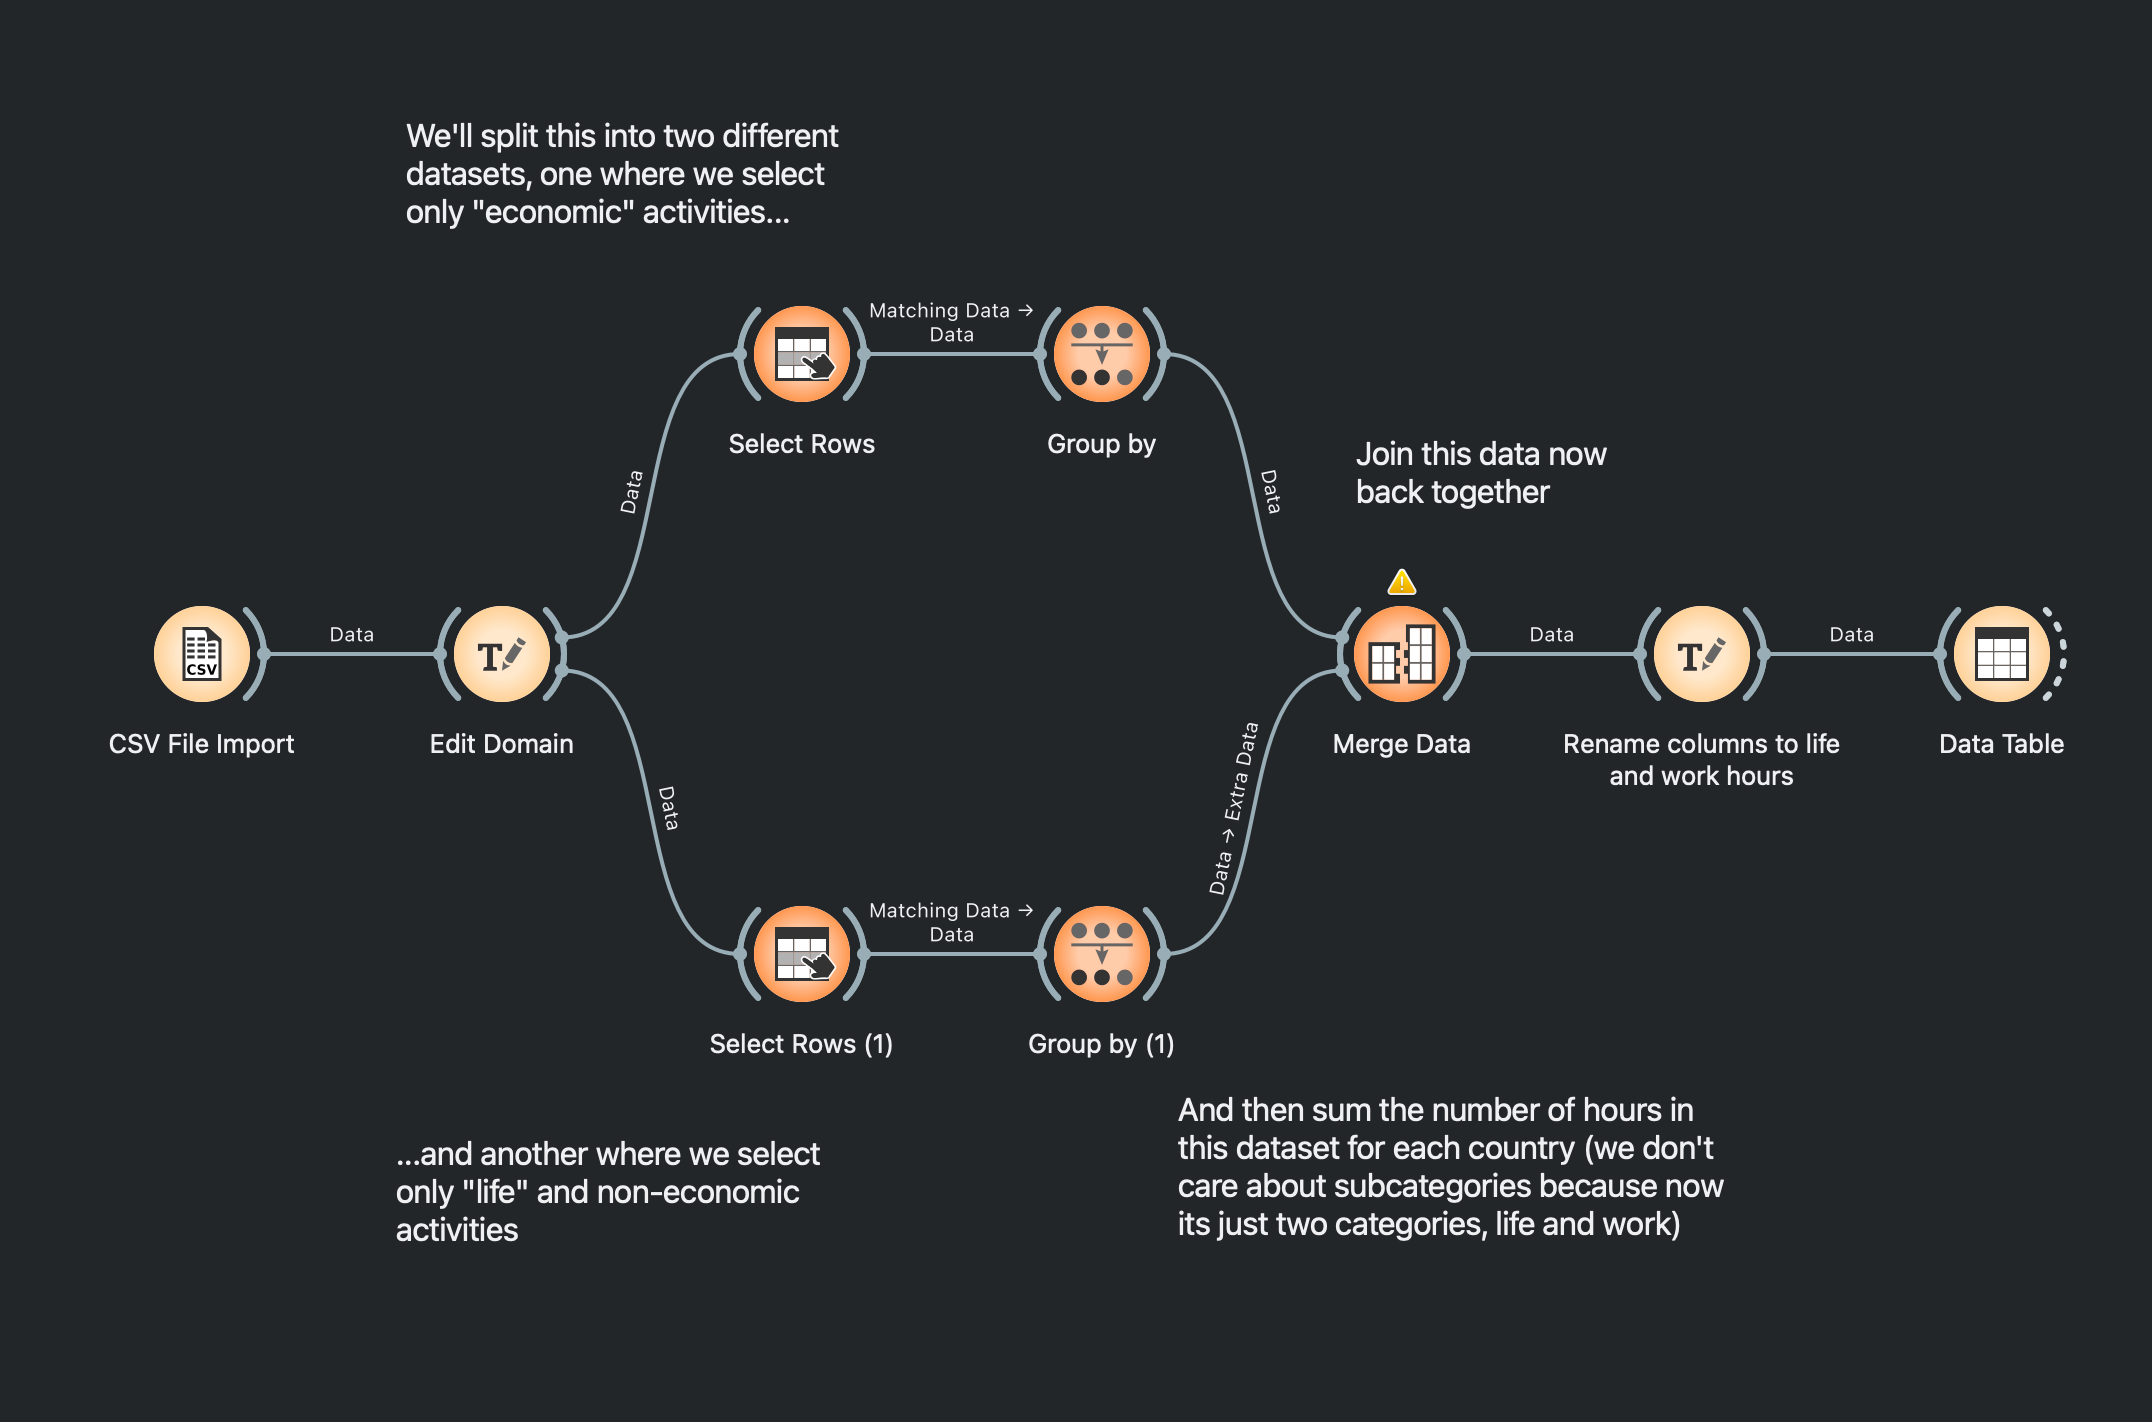
You can download this Orange workflow here: Download Workflow
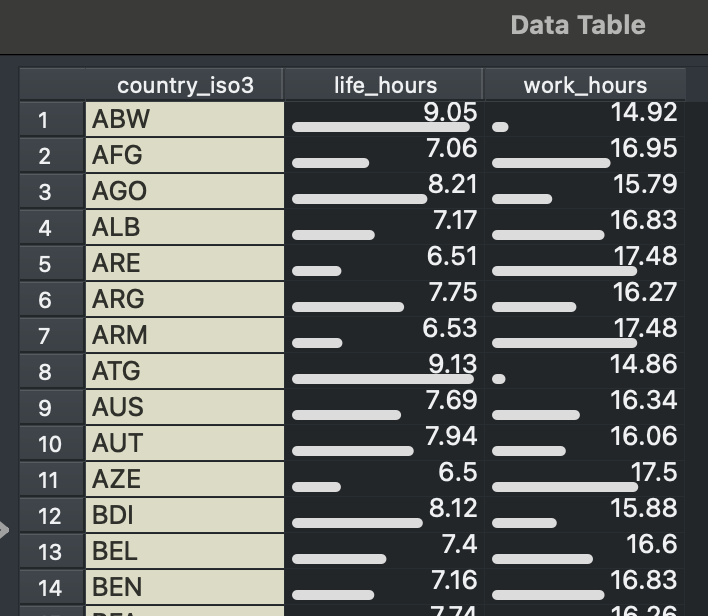
Essentially, we filter this dataset into two things, those with “economic categories” (“Food growth & collection” + “Food processing” + “Materials” + “Energy” and so on) and those without (“Sleep” + “Meals” + “Social” + “Passive” and so on). Then, we can sum these hours using GROUP BY for, let us say, countries. We’ll get this when we join the two split datasets together:
🍊 Orange
Should I sum, count or average?
When to use each:
| Function | Purpose | Example Use Cases |
|---|---|---|
| SUM | Adds all values together within a group | • Total hours spent on sleep across all regions • Combined fare paid by all first-class Titanic passengers • Total duration of all songs in the Pop genre |
| COUNT | Tallies the number of instances/rows in each group | • Number of passengers in each Titanic class • Count of countries per region in the Global Human Day dataset • How many songs fall into each playlist genre |
| MEAN | Calculates the average value within a group | • Average danceability of songs by artist • Average ticket price by class • Mean hours spent on childcare activities by region |
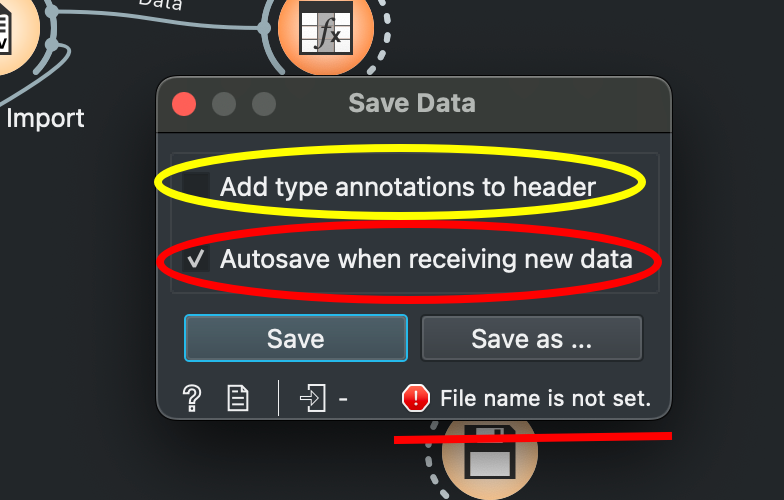
How do I save data?
Make sure the yellow circled checkbox is unchecked and the red one is checked. Also remember to set the file name (red underline error indicates file is not being saved). By default Orange will save in .tab format, choose CSV.
How do I select multiple groups in GROUP BY?
Hold down CTRL while you select groups to select multiple
My GROUP BY has too many columns!!
Make sure you unselect everything before you create a summary with the variable you’re interested in. By default, when you add a new GROUP BY widget in Orange, you’ll see various things like Concatenate and stuff selected on the right side.
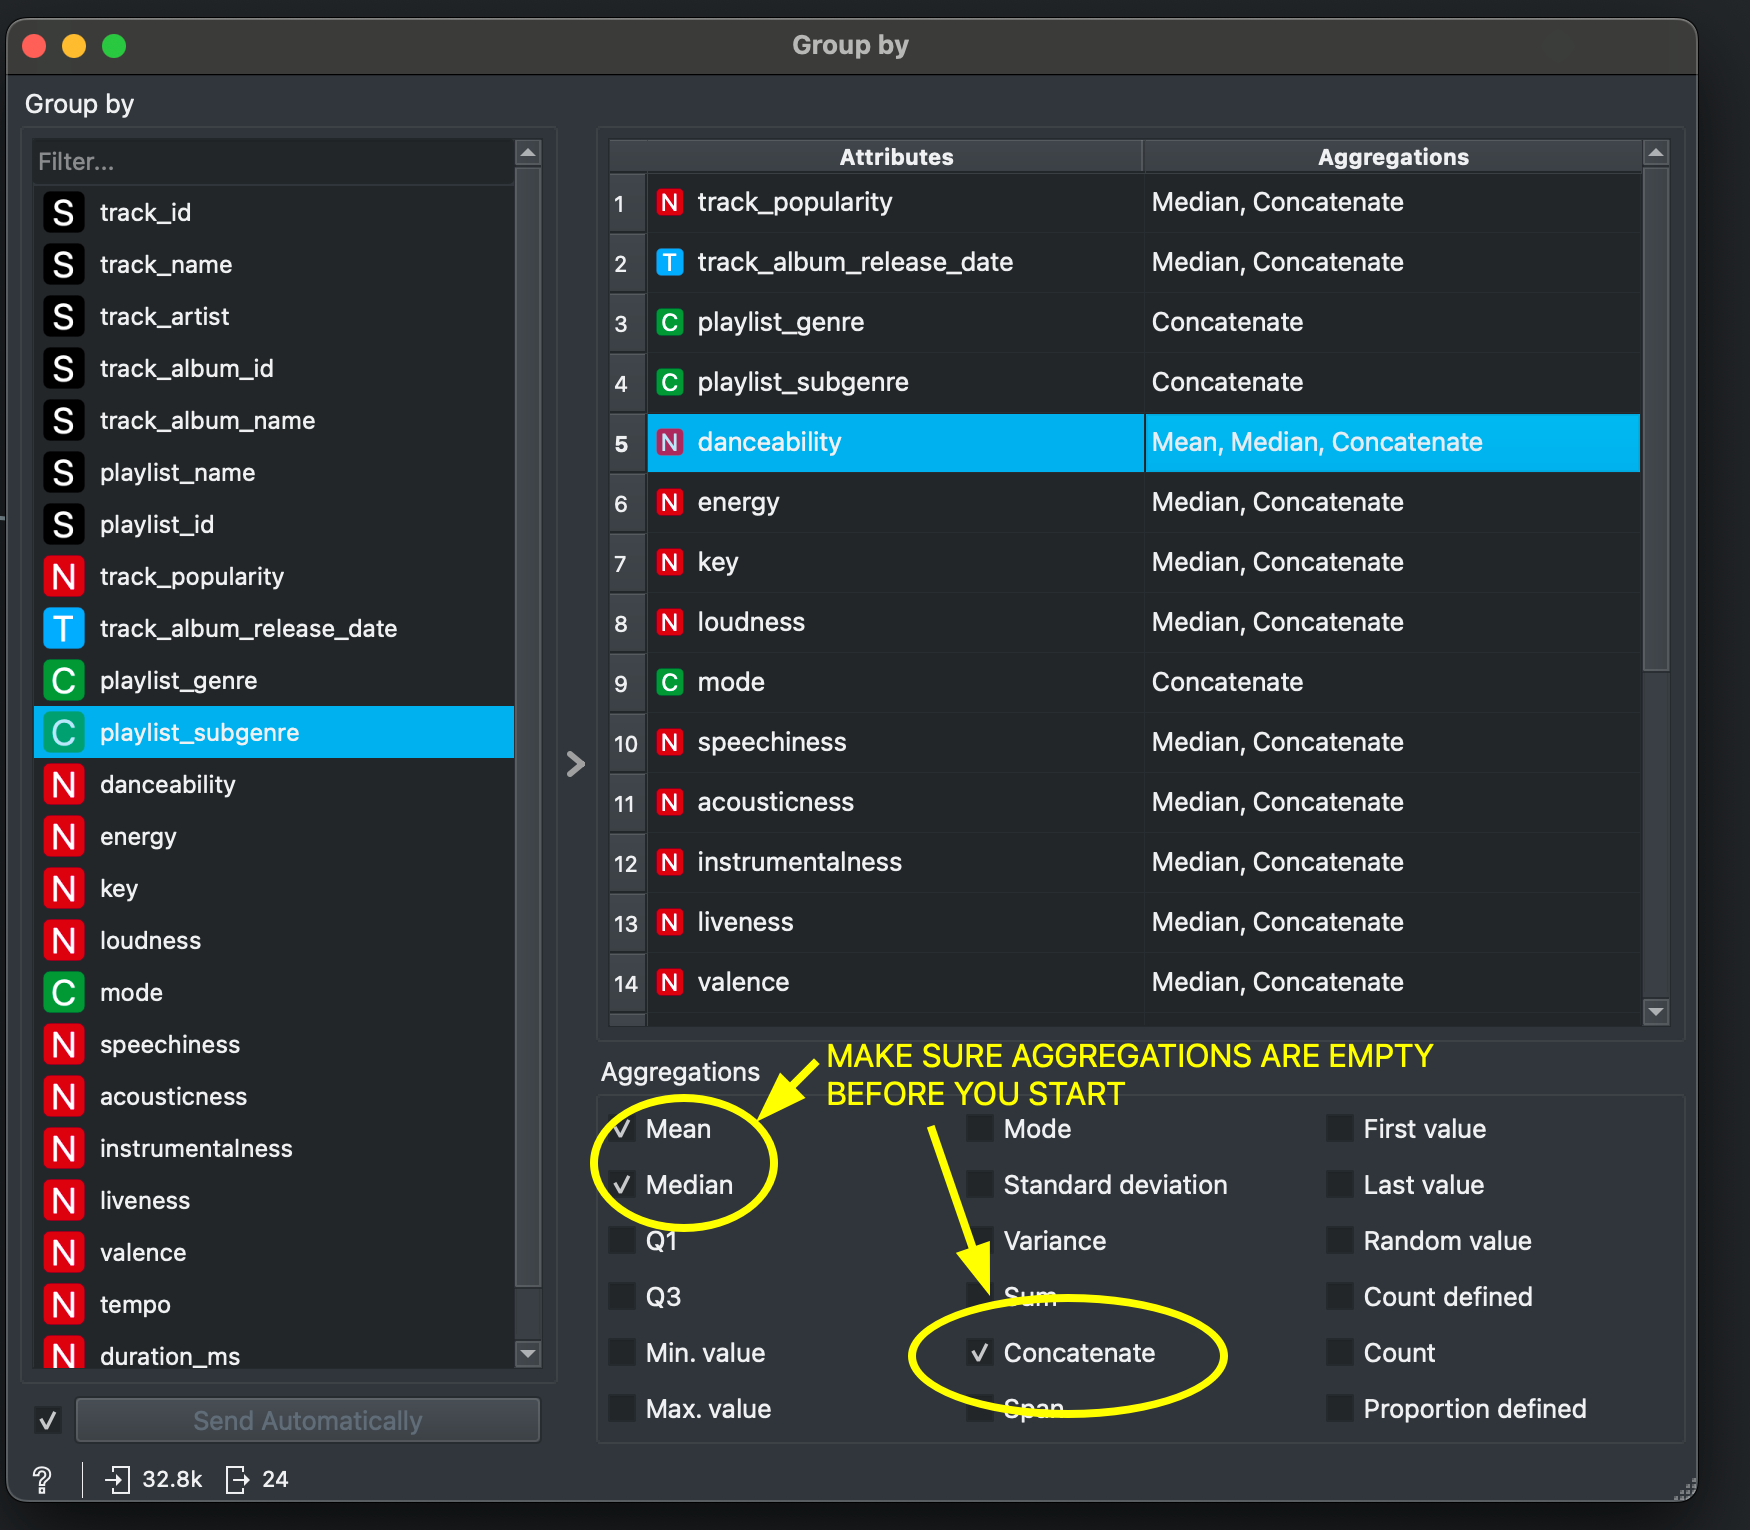
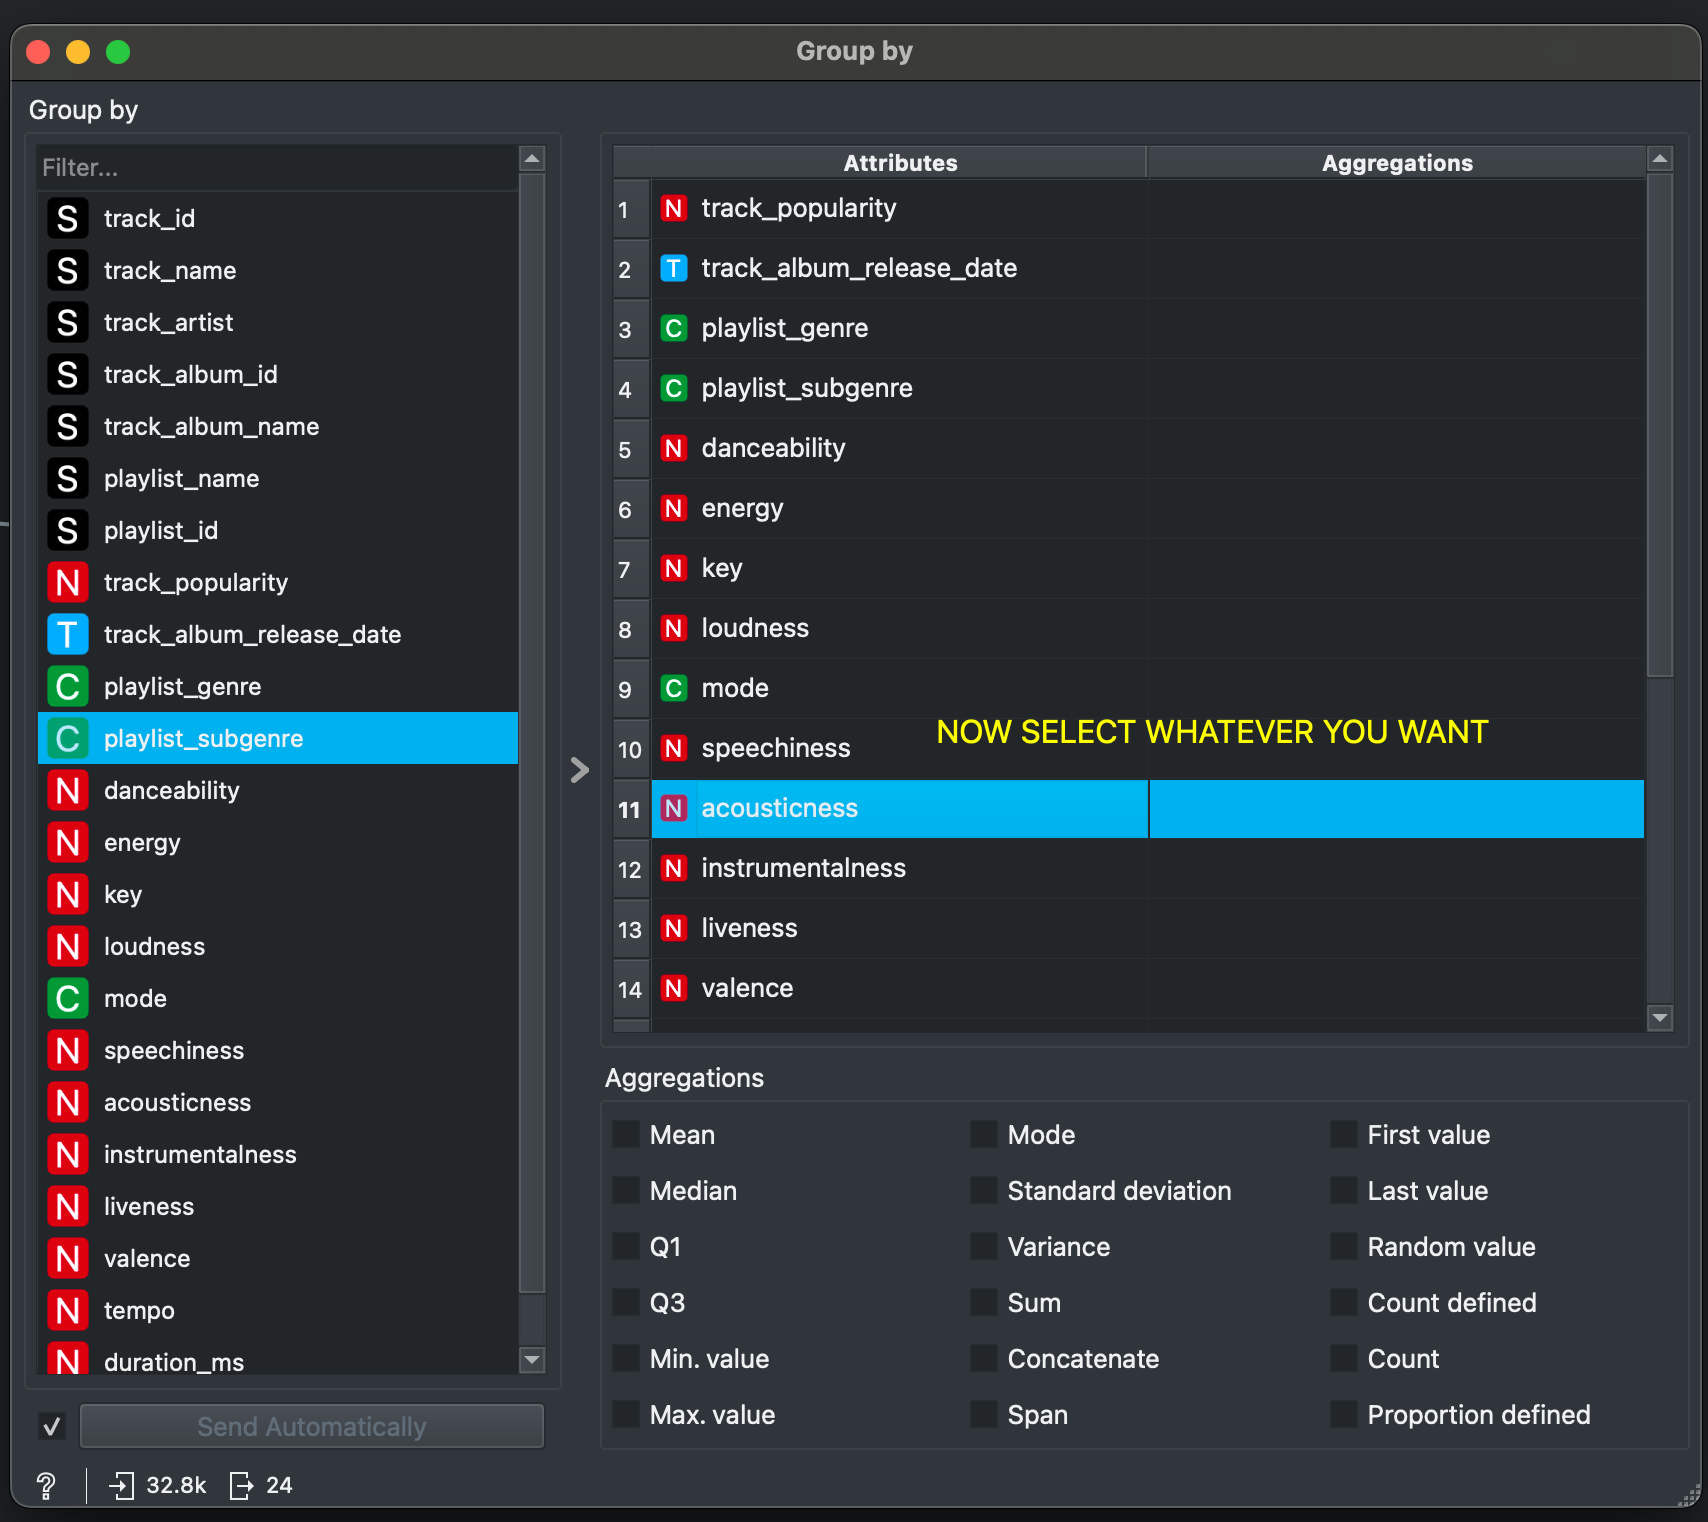
To unselect, click anywhere on the right pane and press CTRL+A to select everything. Then, one by one, click on all things that have been ticked in the Aggregations column like mean, mode, concatenate etc. You will have to click on these multiple times to ensure they all go so make sure everything is unselected (and looks clean like below).
📊 Datawrapper
How do I show two different lines or multiple bars for stuff like male vs female or two comparisons.
If your dataset looks like this and you want to plot a line chart with TWO different lines, then Datawrapper will ask you to have to separate columns for each category you want to plot (Rawgraphs does it without need this).
| year | category | value |
|---|---|---|
| 2020 | male | 45 |
| 2020 | female | 52 |
| 2021 | male | 48 |
| 2021 | female | 55 |
| 2022 | male | 51 |
| 2022 | female | 58 |
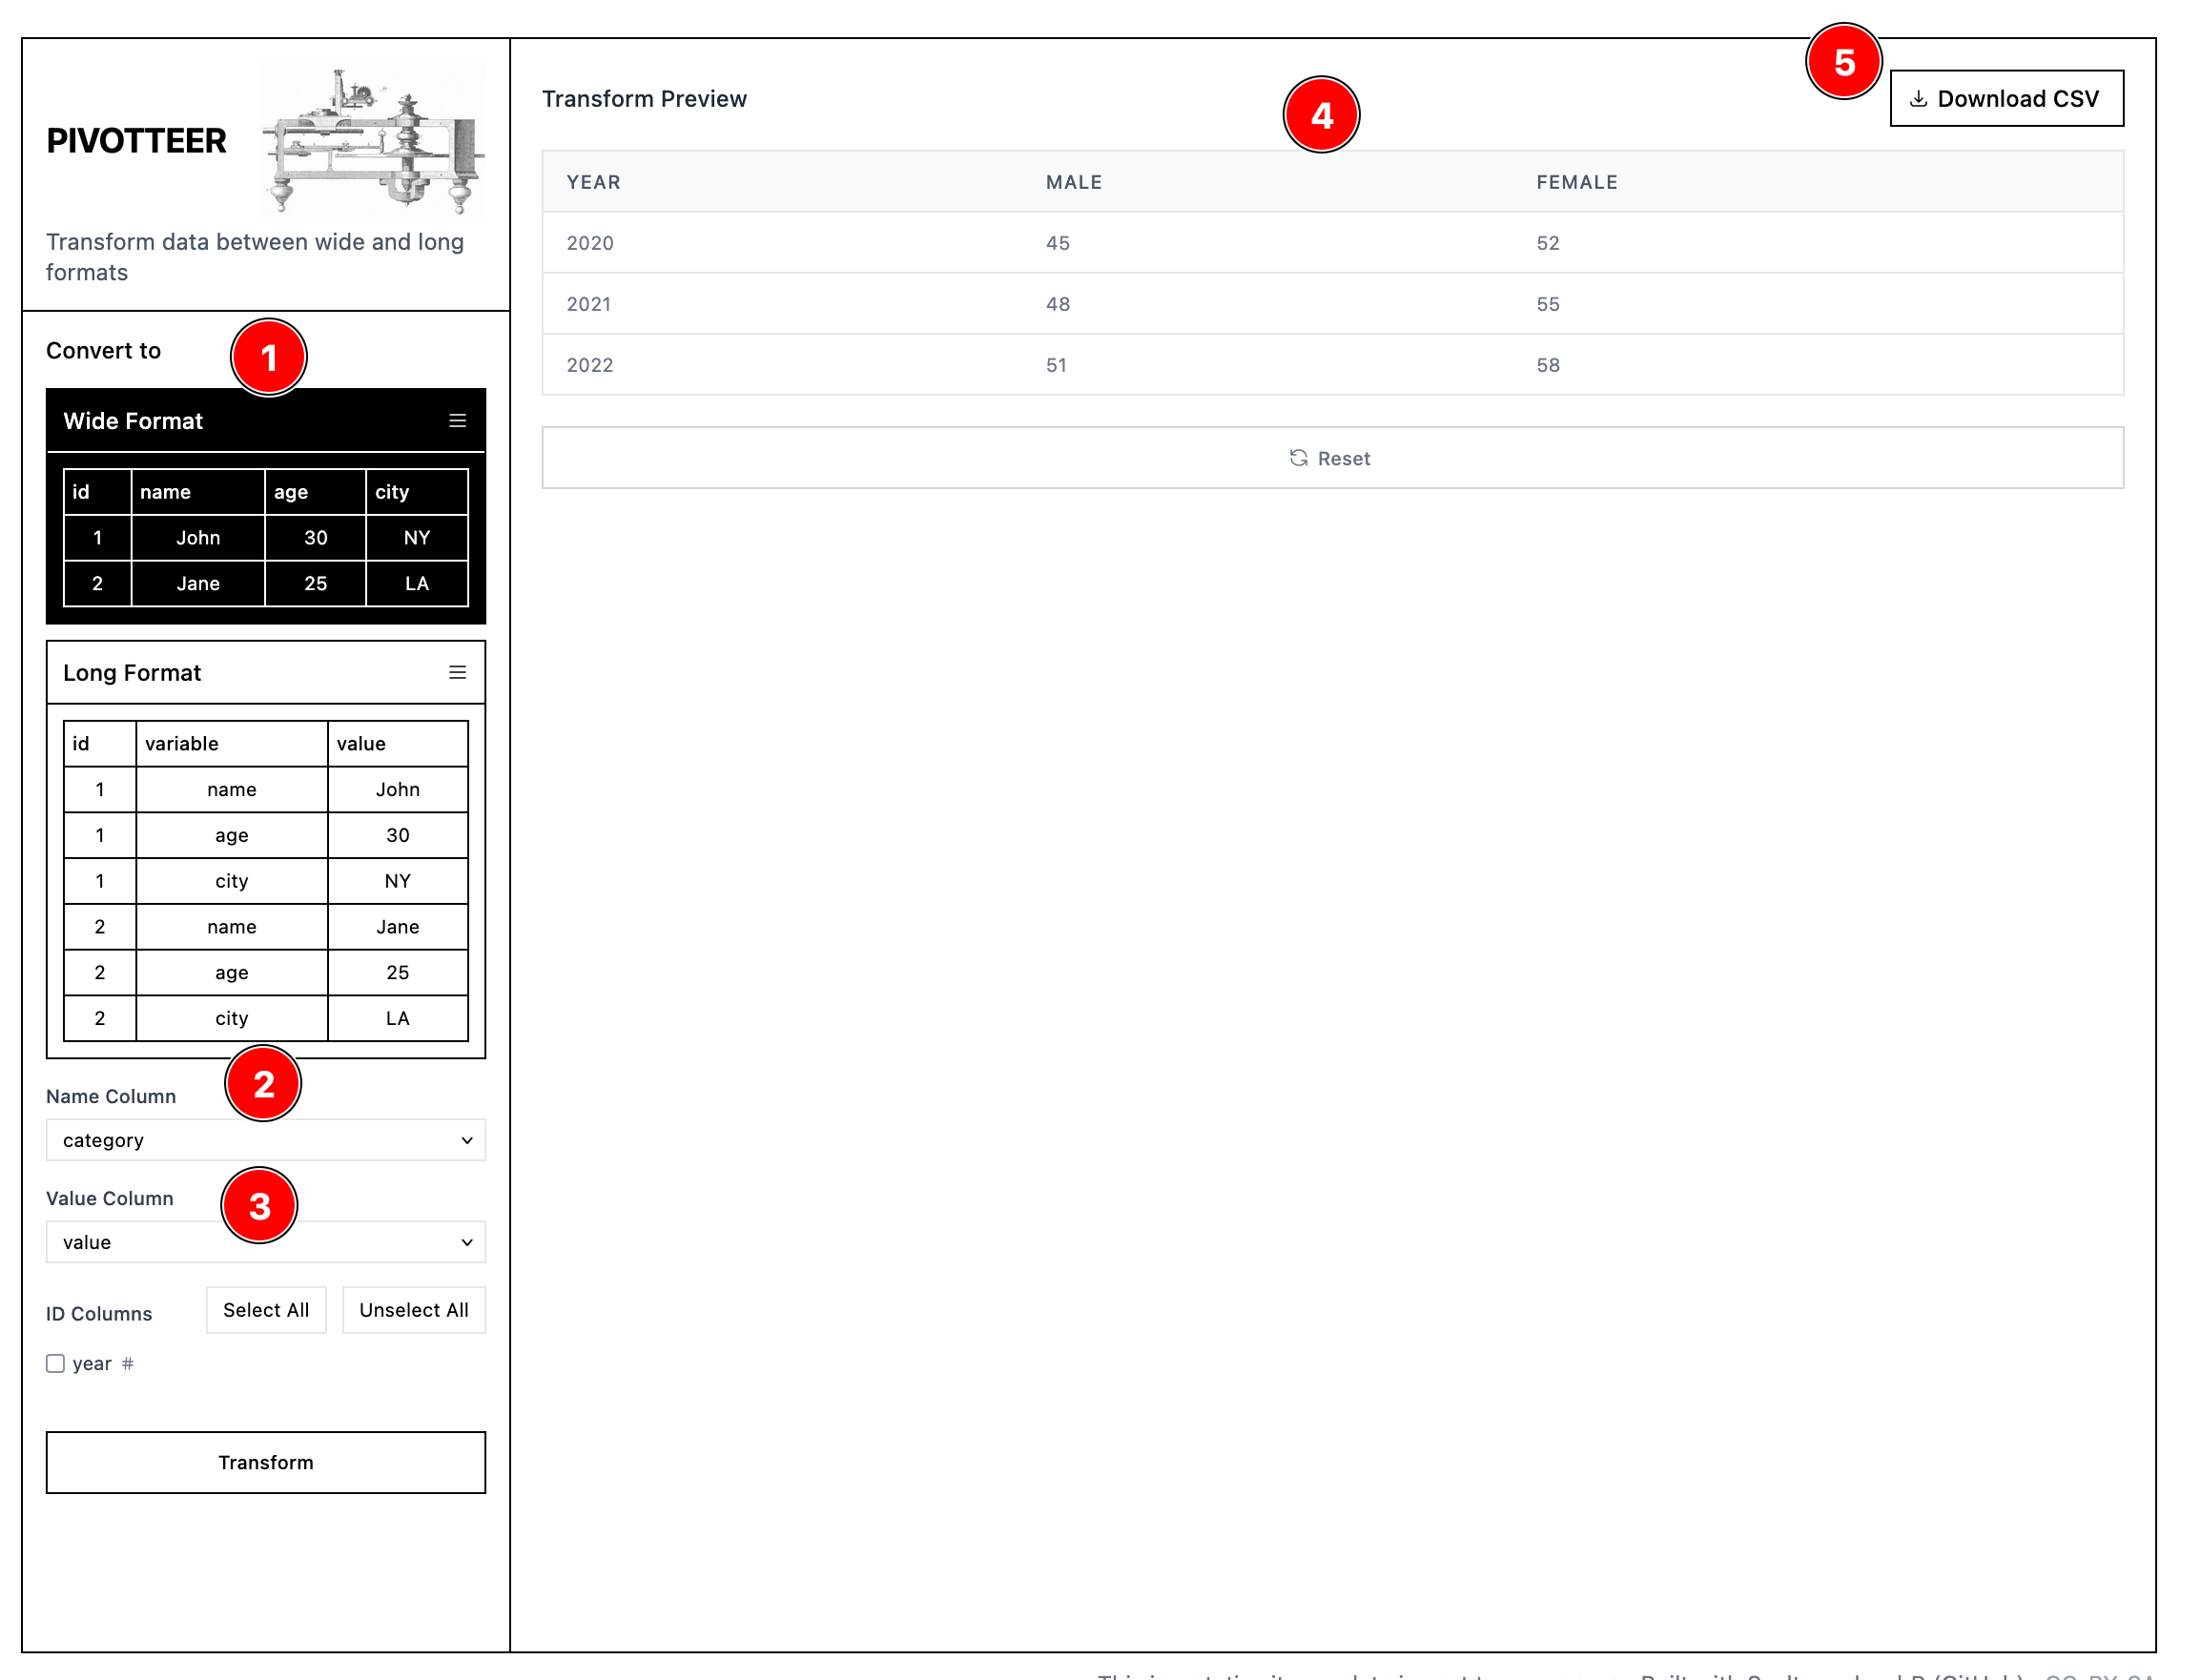
In that case, head over to Pivotteer and upload your CSV there.
Your data is currently in long format but you need to convert it to wide. Select Wide in Pivotteer (marked 1).
Now, you want to create TWO NEW COLUMNS from the original category column (male and female) so that you can plot a comparison. So in the Names Column choose category (marked by 2). This will create a new male and female column. But we still need some values, right? In the original dataset the values come from value column (marked by 3).
In the Value Column select value and then click Transform button. You should see this in the dataset preview (marked by 4). You can then download this converted file by clicking 5 and take it further.