Day 3: The Whole Game
Today we want to try going from generating a summary analysis and then taking that data into Datawrapper.
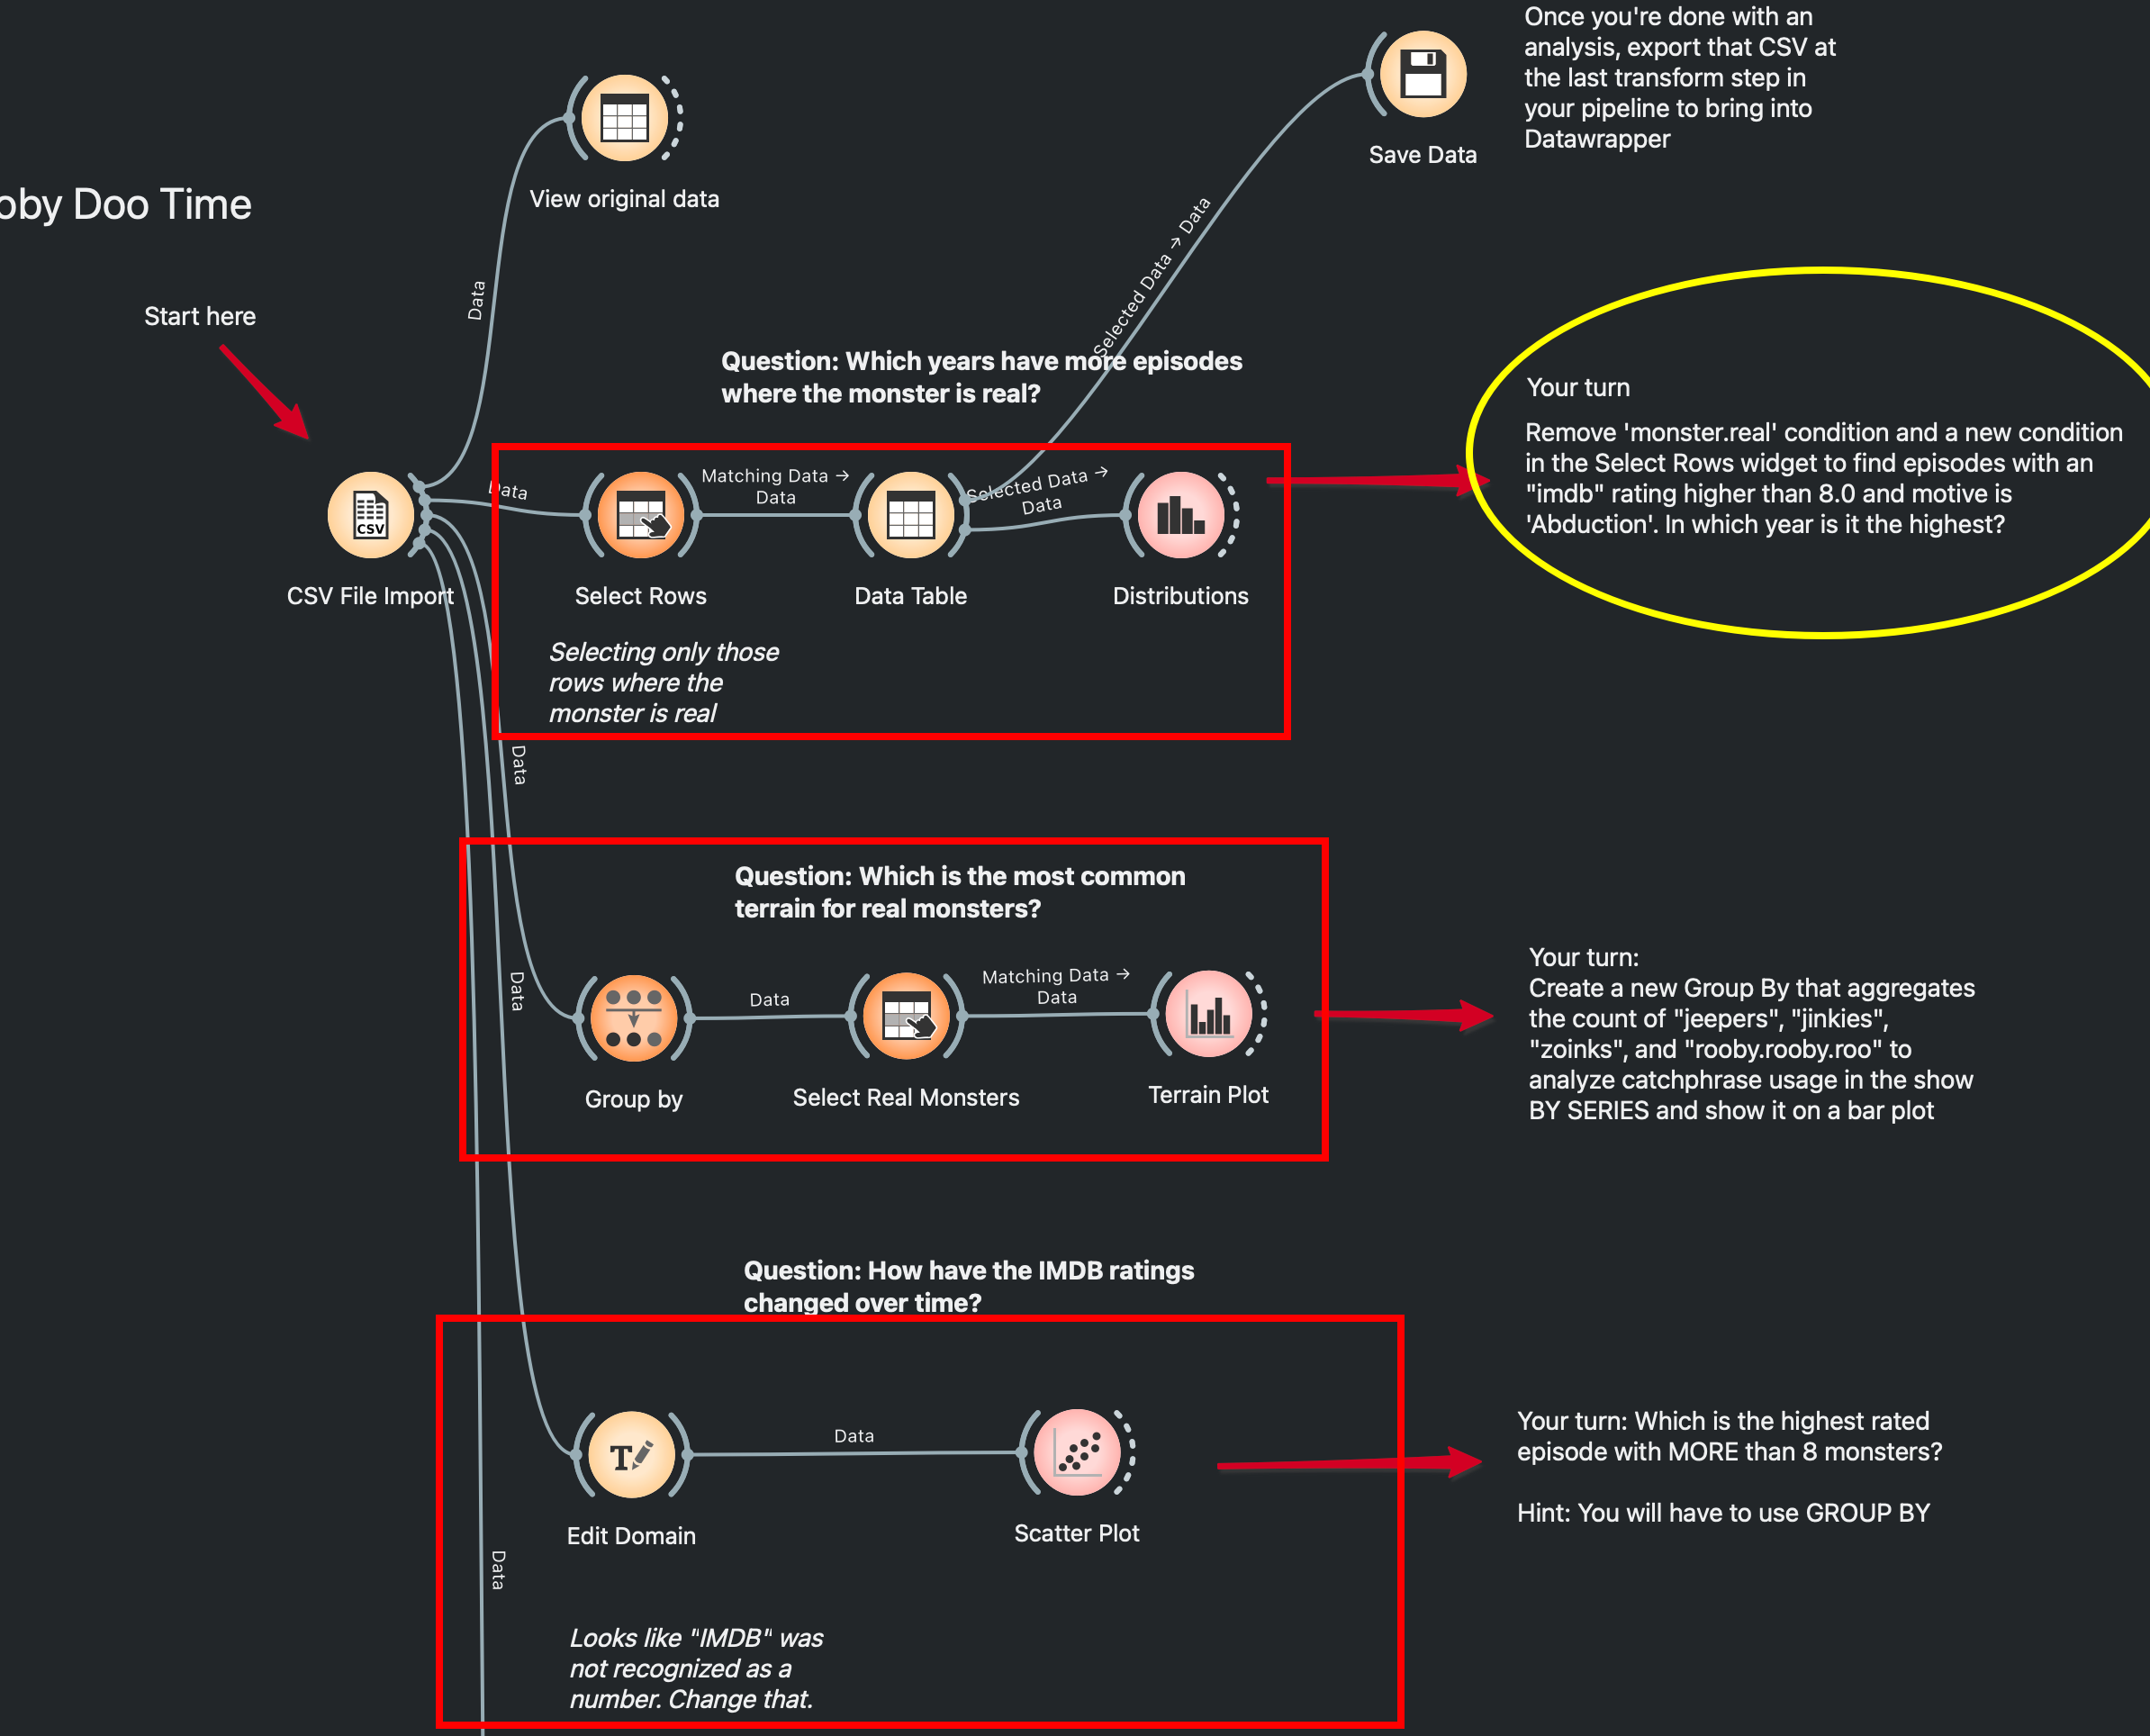
We’ll start our day with going over some of the key concepts from Orange yesterday. I’ve prepared an annotated file for you which is available here:
The dataset is available for download at this link. You will have to CMD or CTRL + S.
It is laid out like this:

You will:
- Look in detail at what EACH STEP OF THE STAGE is doing in the pre-done, pre-answered example (red boxes).
- Answer the related question by creating a new pipeline or changing values (duplicate your copy to save any progres).
Data Dictionary
Please find the data dictionary here: https://github.com/rfordatascience/tidytuesday/blob/main/data/2021/2021-07-13/readme.md
Data Rappers
We’re going to learn Datawrapper by mucking around with it first through this excellent tutorial by Lena Groeger.
Basic Data Requirements
Tabular Format: Datawrapper expects data in a tabular format, like spreadsheets or CSV files.
- Columns represent variables
- Rows represent individual entries or observations
Headers: Always include column headers in your first row.
- Use clear, descriptive names
- Avoid special characters or excessively long names
Clean Data: Datawrapper works best with pre-cleaned data.
- Remove unnecessary columns
- Fill or handle missing values appropriately
- Ensure consistent formatting across columns
Format Requirements by Chart Type
Line Charts
- Need at least one column for the x-axis (usually time/dates)
- Need at least one numeric column for the y-axis
- Example structure:
Date,Revenue,Expenses
2023-01,5000,4000
2023-02,5500,4200
2023-03,6000,4500
Bar/Column Charts
- Need one categorical column for labels
- Need at least one numeric column for values
- Example structure:
Country,Population
USA,331000000
China,1412600000
India,1380000000
Pie/Donut Charts
- Need one categorical column for segments
- Need one numeric column for values
- Example structure:
Category,Sales
Product A,1200
Product B,800
Product C,600
Scatter Plots
Need at least two numeric columns (x and y coordinates)
Optional third numeric column for bubble size
Example structure:
Country,GDP,LifeExpectancy,Population
USA,65000,78.8,331000000
China,10500,77.1,1412600000
India,2000,69.7,1380000000
Appendix
Data Reshaping Cheatsheet
Melt
Purpose: Transforms wide-format data to long-format by unpivoting columns into rows.
When to use:
- When you need to convert multiple columns into key-value pairs
- For visualization tools that prefer long-format data
- To normalize data for analysis
Example
Before (Wide Format):
   ID  Name  Math  Science
   1   John  90    85
   2   Jane  95    92
After (Long Format):
   ID  Name  Subject  Score
   1   John  Math     90
   1   John  Science  85
   2   Jane  Math     95
   2   Jane  Science  92
Pivot
Purpose: Reshapes long-format data into wide-format by pivoting rows into columns.
When to use:
- When you need to create a summary table
- To reshape data for reporting or visualization
- To create crosstabs or contingency tables
Example
Before (Long Format):
   ID  Name  Subject  Score
   1   John  Math     90
   1   John  Science  85
   2   Jane  Math     95
   2   Jane  Science  92
After (Wide Format):
   ID  Name  Math  Science
   1   John  90    85
   2   Jane  95    92
Transpose
Purpose: Flips data so rows become columns and columns become rows.
When to use:
- When you need to quickly flip the orientation of your data
- For certain statistical analyses that require variables in rows
- When preparing data for specific visualization formats
Example
Before:
     A  B  C
Row1  1  4  7
Row2  2  5  8
Row3 3 6 9After:
     Row1  Row2  Row3
A    1     2     3
B    4     5     6
C    7     8     9
Quick Comparison
| Operation | Input → Output | Preserves All Data | Aggregation | Common Use Case |
|---|---|---|---|---|
| Melt | Wide → Long | Yes | No | Converting multiple measure columns to rows |
| Pivot | Long → Wide | No (needs aggregation if duplicates) | Optional | Creating summary tables, crosstabs |
| Transpose | Flips entire table | Yes | No | Simple rotation of data structure |
Visual Representation
Melt
Wide Format:          Long Format:
+----+------+----+    +----+------+--------+-------+
| ID | Name | A  | B  | ID | Name | Column | Value |
+----+------+----+    +----+------+--------+-------+
| 1  | John | 10 | 20 | 1  | John | A      | 10    |
+----+------+----+ => +----+------+--------+-------+
                      | 1  | John | B      | 20    |
                      +----+------+--------+-------+
Pivot
Long Format:            Wide Format:
+----+------+----+----+ +----+------+----+----+
| ID | Name | Col| Val| | ID | Name | A  | B  |
+----+------+----+----+ +----+------+----+----+
| 1  | John | A  | 10 | | 1  | John | 10 | 20 |
+----+------+----+----+ +----+------+----+----+
| 1  | John | B  | 20 |
+----+------+----+----+
Transpose
+-----+----+----+       +-----+-----+-----+
|     | A  | B  |       |     | Row1| Row2|
+-----+----+----+       +-----+-----+-----+
| Row1| 1  | 2  |  =>   | A   | 1   | 3   |
+-----+----+----+       +-----+-----+-----+
| Row2| 3  | 4  |       | B   | 2   | 4   |
+-----+----+----+       +-----+-----+-----+